TOOL
FORSPEF Portal
Overview
The FORSPEF portal is accessible via the URL address http://tromos.space.noa.gr/forspef . The web portal was designed in such a way so an optimal viewing experience is provided across a wide range of devices (mobile phones, tablets, desktop computer monitors). This responsive design was accomplished via a layout based on the Bootstrap open-source front-end framework. It is built to work best in the latest desktop and mobile browsers (Chrome, Firefox, Internet Explorer, Safari, and Opera).
Main Page
The layout of the Main Page uses a fixed navigation bar on the top of the page. The navigation bar provides the following seven links: ABOUT, PREDICTIONS, NOTIFICATIONS, ARCHIVE, CONTACT, INFO, ADMIN, HELP and a separate link on the left called TOP. This latter link directs the user to the top of the page each time is clicked. In smaller devices the navigation bar appears as a single menu button. When this button is clicked, accordion style navigation is expanded. The 'About' link directs the user to a section further down in the Home page which provides information in brief about the objective, the methodology and the outcomes of the FORSPEF activity. The 'Predictions', 'Notifications' and 'Archive' links direct the user to the corresponding FORSPEF web pages (see below for a description). The 'Contact' section is accessible via the 'Contact' link. This section provides a form for contacting the FORSPEF team.
Predictions Page
FORSPEF results are presented in the Predictions Page. The navigation bar provides the links FORECAST, NOWCAST, SEPCHARACTERISTICS, TOP on the right side and a HOME link on the left. The latter directs the user to the FORSPEF’s Main Page. FORSPEF incorporates a dual work scheme, therefore, at this point the user may retrieve the results of the SEP occurence forecasting based upon the input received by the SF forecasting (option: FORECAST), the nowcasting of SEP occurrence based on the actual near-real time data (option: NOWCAST) as well as the expected SEP characteristics for the given solar flare, under the nowcasting work scheme (option: SEP-CHARACTERISTICS). All the output csv files produced by the three FORSPEF modules are accessed by the web page when a user selects the 'Predictions' link.
Forecast
In this area of the web portal the most recent full-disk SDO/HMI magnetogram is displayed as produced by the FORSPEF solar flare forecasting module. On this magnetogram, the solar active region is marked with a rectangle. When the user places the mouse cursor near the center of the active region, a pop-up image showing the respective probability distribution for the different flare classes and the CME likelihood curve is presented. The following link navigates the user to the forecasts area.
Nowcast & SEP Characteristics
In order to visualize the detailed information and data given in the SEP Characteristics and the Nowcast results, bubble charts were used in order to plot all three dimensions of the output data. In particular, under the Nowcast option, the plots depict the probability of SEP occurrence and the bubble size varies with the SEP probabilities enabling thus the identification of the events with the highest probabilities. For the first three graphs, the x-axis presents the coordinates of the associated solar flare as the solar longitude, ranging from -90 to 90 deg. The y-axis is the Flare Flux (in W/m2) expressed in logarithmic scale. All of these plots are implemented on the basis of different solar flare inputs, labeled under each sub-option. The fourth graph under this option (i.e. Nowcasting) illustrates the expected probability of SEP occurrence based on near real-time CME data. As a result, the x-axis presents the speed of the CME (in km/s) and the y-axis the width of the CME (in degrees). Additionally, under the SEP Characteristics options, in the first three graphs the x-axis presents the coordinates of the associated solar flare as the solar longitude, ranging from -90 to 90 deg and the y-axis is time (in UT), while for the fourth plot, the x-axis is the speed of the CME (in km/s). All nowcast textural output are reproduced in the graph area as a legend. For the SEP Characteristics, part of the textural output is reproduced in the graph legend. In parallel, for both options (i.e. Nowcast, SEP Charactersitics) a tooltip is enabled each time the mouse passes over a bubble. In addition to the bubble charts, for the SEP characteristics, temporal profiles are constructed based on the Integral Peak Proton Flux at E>30 MeV. For the Forecast, Nowcast and the SEP Characteristics their header and values are automatically printed in the web page as an html table along with a sub header indicating the time of the forecast and/or nowcast. The table is viewed optionally by pressing the 'Toggle table view' button under each plot (in the Nowcast and the SEP Characteristics options).
Archive Page
The FORSPEF’s tool archiving functionality has been activated in November 2015. For forecasts, the archived data in the FORSPEF database include events starting from 8/1/2016. For Nowcast and Sep characteristics, depending in the input source, the database includes events starting from: i) 28/9/2015 for inputs from Flare Mail/ROB Webservice and Solar Demon/ROB Webservice, ii) 7/11/2015 for inputs from the Solar Demon/ROB Webpage and iii) 25/11/2015 for inputs from CACtus. FORSPEF archived predictions are accessed via a simple search GUI provided by the 'Archive' link in the main navigation bar. In the search GUI, the user enters manually or selects the Start and End dates of the temporal search from two separate calendars. After the query is submitted all archived results are retrieved and displayed on the user’s screen. The layout of the results screen is identical to the one adopted in the Predictions Page but in this case the textural output are not reproduced in the graph area as a legend. The user can still view optionally the respective data tables by pressing the ‘Toggle table view’ button.
Notifications Page
In the Notifications page, the user can sign up in order to receive system notifications. System notifications are email messages sent to registered users when the estimated probability of a SEP occurrence is >0.25. The fields that a user is requested to submit during the signup process and which are stored in the internal database are: Last Name, First Name, Email and Affiliation. An anti-spam field is also provided.
Admin Page
The Admin Page enables the effective management of the user profiles (e.g. editing, adding or removing user profiles). The user administration interface is accessible via the 'Admin' link at the top right of the Main Page. The user is redirected towards a login screen. Upon successful login, the user is redirected to the administrator’s interface. This interface initially displays the contents of the database that holds all the user profiles. in a table form. For each table record, links for editing, adding or deleting a user profile are given. An on-line form is provided in modal form that provides the capabilities to edit or delete a registered profile. A screenshot of this interface is presented. The administrator’s interface offers also the possibility for querying the database and sorting the stored records by one or several fields.
Scientific Background
Solar Flares
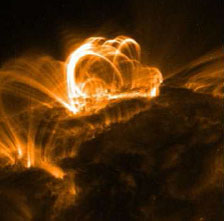
Figure 1: A typical X-class solar flare observed by TRACE in September 2005.
Solar flares (SFs) are sudden, violent and very energetic explosions occurring in active regions (ARs) around sunspots. They are powered by sudden large changes of the local magnetic field topology through reconnection processes that lead to huge releases of magnetic energy. During SFs, magnetic energy of 1028–1034 erg is released in the solar chromosphere and corona over a few minutes[Benz, 2008]. This energy release in turn leads to plasma heating, particle acceleration and mass transport and produces electromagnetic radiation across the electromagnetic spectrum at all wavelengths from long wave radio to the shortest wavelength gamma rays [Anastasiadis, 2002]. During a large solar flare, the X-ray flux increases by many orders of magnitude compared to the pre-flare X-ray levels.
Coronal Mass Ejections (CMEs)
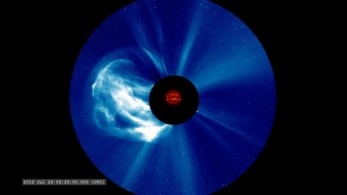
Figure 2: The massive CME of 23 July 2012 as recorded by STEREO-B (from http://svs.gsfc.nasa.gov/cgi-bin/details.cgi?aid=4178).
Coronal mass ejections (CMEs) are large-scale solar eruptions during which mass and energy are being released from the Sun to the interplanetary (IP) medium. CMEs are being regularly monitored by white-light coronagraphs at 1 AU onboard the SOHO [Domingo, Fleck, and Poland, 1995] and the Solar TErrestrial RElations Observatory (STEREO) missions [Kaiser et al., 2008]. Most of the ejected material comes from the low corona, although cooler, denser material probably of chromospheric or photospheric origin is also sometimes involved. The CME plasma is entrained on an expanding magnetic field, which commonly has the form of helical field lines with changing pitch angles, i.e., a flux rope [Webb and Howard, 2012].
Solar Energetic Particle (SEP) Events
Solar Energetic Particles (SEPs) are observed as flux increases above a background level, and their energies range from ~ 10keV to 10GeV/nuclei, while their duration can last from a few hours to several days. SEPs consist of electrons, protons, alpha particles and heavier ions up to Fe [Reames, 2012]. The classical paradigm is to divide SEP events into two categories: the impulsive and the gradual ones based on their parent solar events [Reames, 1999]. Impulsive SEP events are considered to be associated to SFs, while the gradual ones are considered to be accelerated by CME-driven shocks.
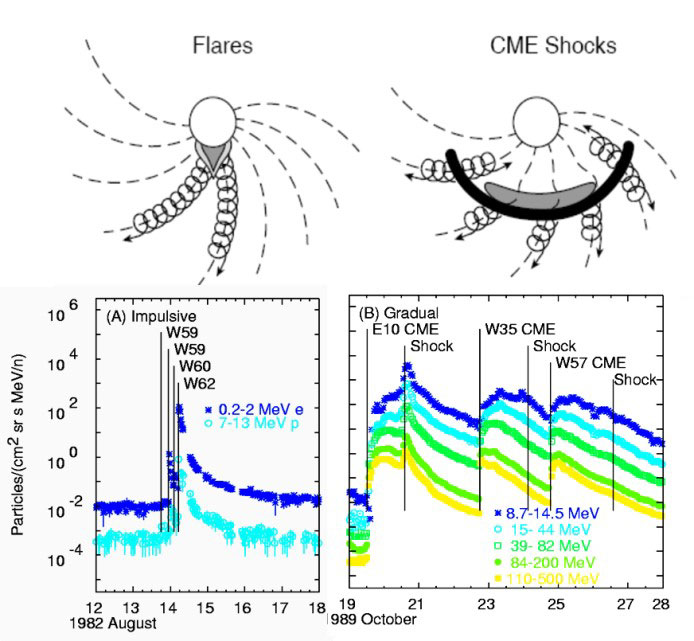
Figure 3: An illustration of the classical SEP classification. Intensity-time profiles of electrons and protons in ‘pure’ (a) impulsive and (b) gradual SEP events. Panels on the left presents a series of impulsive SEP events and their generator: the solar flare, while panels on the right present a series of the gradual SEP events and their causative, CMEs (taken by Reames, 2012).
SEP events are produced in the solar atmosphere by particle acceleration processes in association with powerful M and X class flares and in interplanetary shocks created by the interaction of CMEs with the solar wind. Accelerated particles then propagate through the interplanetary medium, spiralling along the interplanetary magnetic field (IMF). Figure 4 presents cartoons of the two possible acceleration mechanisms. In the left panel, the flare acceleration scenario is presented. It implies that SEPs are accelerated together with the particles radiating γ rays (γR), Hard X-rays (HXR), radio and Soft X-rays (SXRs), escaping to open flux tubes towards the IP space. In the right panel, a CME, its interplanetary counterpart (ICME) and the CME-driven shock are presented. SEP events are thought to be accelerated at the CME-driven shock of relatively fast CMEs.
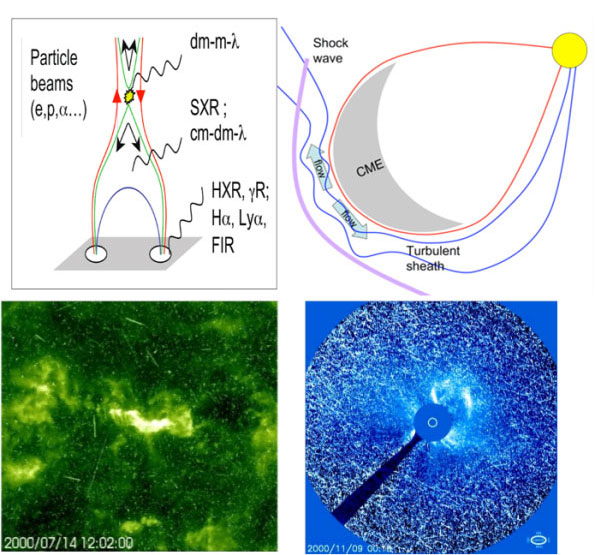
Figure 4: Acceleration processes for SEP events. The 'flare acceleration' is presented in the left panel, whereas the 'CME acceleration' in the right panel (top row). Actual solar storms (SEP events) generated by SFs and CMEs, respectively (bottom row) [Images courtesy of the NASA/ESA SOHO and the NASA/SDO missions].
FORSPEF Tool
The FORecasting Solar Energetic Particles and Flares (FORSPEF) tool provides forecasting of solar eruptive events, such as solar flares (SF) with a projection to coronal mass ejections (CMEs) (occurrence and velocity) and the likelihood of occurrence of a solar energetic proton (SEP) event. It also provides nowcasting of SEP events based on actual SF and CME near real-time alerts, as well as SEP characteristics (peak flux, fluence, rise time, duration) per parent solar event. A more detailed describtion on FORSPEF Tool can be found in Papaioannou et al. 2015.
FORSPEF Forecasting mode
Within FORSPEF's forecasting mode, first the SF forecasting takes place, utilizing LOS SDO/HMI full-disk magnetograms, providing 24-hour conditional flare probabilities and eruptive flare likelihoods that can be refreshed at intervals of 3 hours. To achieve this, it calculates values of a prediction parameter of choice, namely Beff, “effective connected magnetic field strength” [Georgoulis and Rust, 2007]. Besides eruptive flare likelihoods it independently provides also projected near-Sun CME speeds and assessments of proximity to Coronal Holes (CHs). All this information is provided per Active-Region Identification Algorithm (ARIA)-identified AR. Next, the detection of SEP events, in terms of probability of occurrence, is performed based on the derived probability for solar flare occurrence (forecasting pre-flare scheme) for a given AR, made available in the previous step. In the forecasting pre-flare emergence scheme, for a given location of an AR, the information stored in a newly constructed SEP database, hereafter FORSPEF database [Papaioannou et al., 2016] is used to derive the Distribution Functions (DFs) of the flare magnitudes associated and/or not associated to SEPs. This corresponds to the local statistical model that is being used for the construction of the DFs. These latter DFs are folded with the solar forecast leading to a weighted forecast [Sandberg et al., 2014]. Using this scheme, statistical outputs (e.g. percentiles) for the SEP occurrence are derived. In what follows, an actual example of the FORSPEF's forecasting scheme is presented. For a given AR (in this case AR12157), the probabilities of flare and CME occurrence are first derived, (right top panel of Figure 5). Results stemming from the FORSPEF database are presented in the bottom left panel of Figure 5. The abscissa corresponds to the flare peak photon flux and the ordinate corresponds to the derived probabilities of SEP occurrence. The probabilities derived by the Solar Flare Prediction are folded with the probabilities derived by the FORSPEF database. This is illustrated at the bottom right panel of Figure 5. FORSPEF provides the maximum probability of SEP occurrence from that bottom right panel of Figure 5.
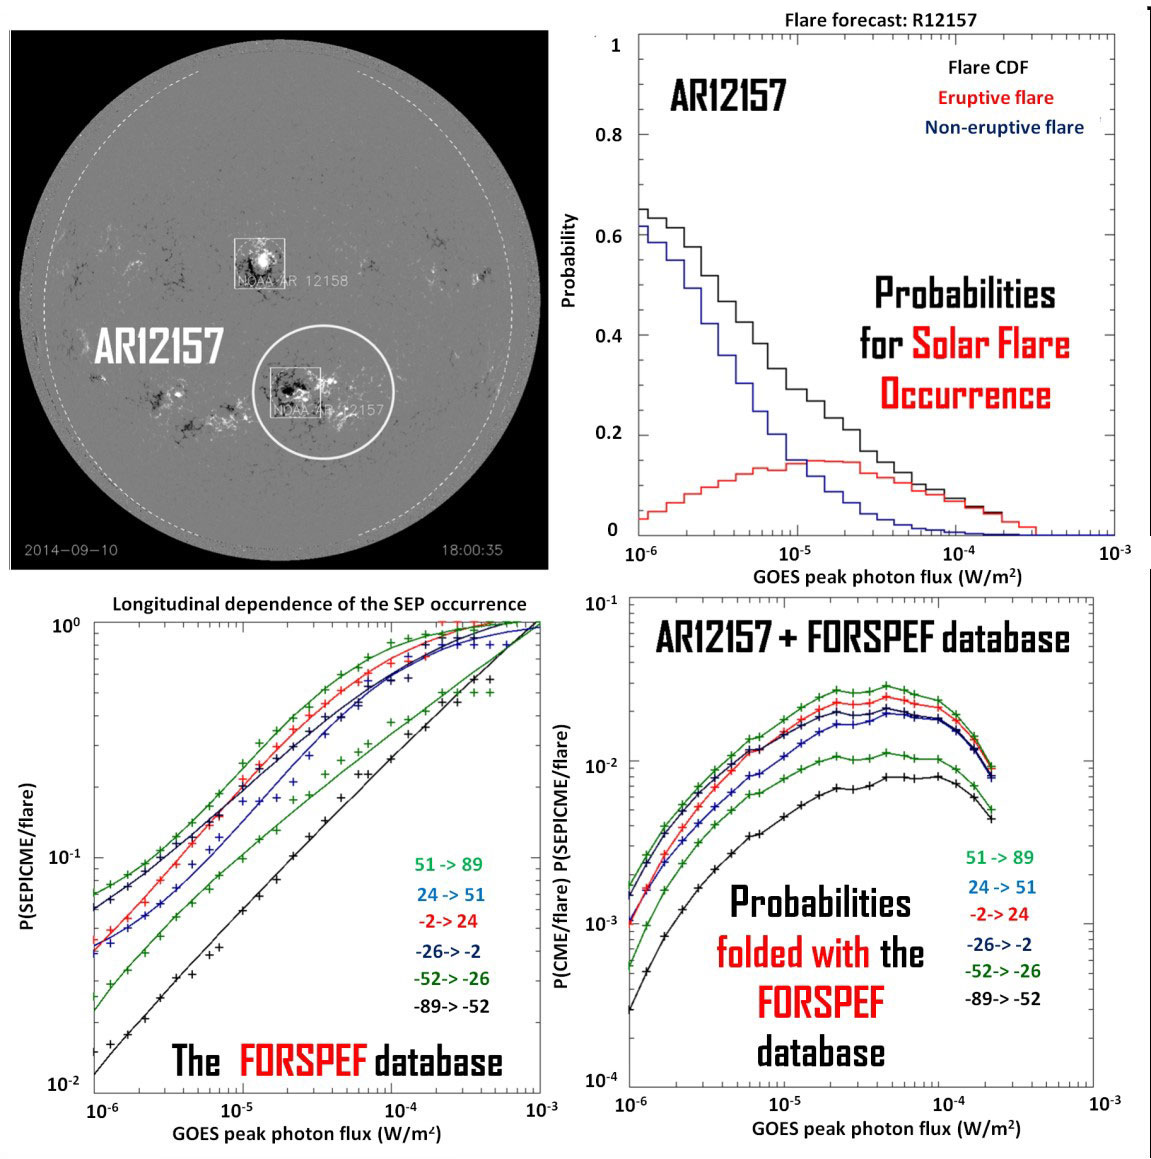
Figure 5: An actual illustration of FORSPEF's forecasting work scheme (taken by Papaioannou et al., 2015)
FORSPEF Nowcasting mode
Detection of SEP events, in terms of probability of occurrence, is performed based on the actual near real-time solar flare data (i.e. maximum solar flare magnitude and position) downloaded in near-real time mode from Solar Demon (http://solardemon.oma.be/flares.php?) a service operated by the Royal Observatory of Belgium (ROB). A typical nowcast (post-flare) warning window is of the order of ~15-20 minutes, while nowcasts are renewed with the identification of any new solar flare event. The SEP nowcast provides the probability of SEP occurrence for a given SF as well as the expected SEP characteristics, calculated based on sub-samples of the FORSPEF database that occur under the pre-requisite of the nearest (in longitude) 4000 historical solar flare events (in case of only SF information made available) and/or 1000 historical flare events accompanied by CME ((in case that the CME occurrence information is made available). The output of the SEP nowcasting (post-flare) scheme is presented in Figure 6. Left panel presents the probability of SEP occurrence using only the SF information, while the right panel presents the same probability in the case that a CME has occurred [Anastasiadis et al., 2015]. Furthermore, nowcasting is also performed based on actual near real-time CME data (i.e. velocity and width) from CACTus, another service from ROB. For each, identified CME, proper fits per CME width (e.g. halo, partial halo, non halo) and velocity, established based on the FORSPEF database are being employed.
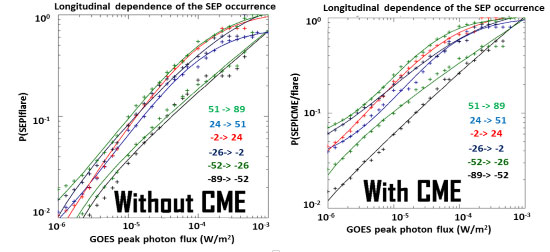
Figure 6: Derived probabilities of SEP occurrence from FORSPEF's nowcasting work scheme under the presence (or absence) of a CME (taken by Anastasiadis et al., 2015).
References
- Anastasiadis A., "Acceleration of solar energetic particles: the case of solar flares", Journal of Atmospheric and Solar-Terrestrial Physics, (64), 481-488, 2002
- Anastasiadis A., Sandberg I., Papaioannou A., Georgoulis M.,Tziotziou K., Jiggens P., Hilgers A., "An operational integrated short-term warning solution for solar radiation storms: introducing the Forecasting Solar Particle Events and Flares (FORSPEF) system", Geophysical Research Abstracts, 17, EGU2015-13120, 2015
- Benz A., "Flare Observations", Living Rev. Solar Phys. 5, (2008), 1.
- Domingo V., Fleck B. and Poland , "The SOHO Mission: an Overview", Solar Physics, 162, 1-37,1995
- Georgoulis M.K. and Rust D.M., "Quantitative Forecasting of Major Solar Flares", Astrophys. J., 661, Issue 1, pp. L109-L112, 2007
- Kaiser M., Kucera T.A., Davila J. M., St. Cyr O. C. , Guhathakurta M., Christian E. ,"The STEREO Mission: An Introduction", In: The STEREO Mission, eds. C.T. Russell, Springer, 5-16, 2008
- Papaioannou A., Anastasiadis, A., Sandberg, I., Georgoulis, M.K., Tsiropoula, G., Tziotziou, K., Jiggens, P., Hilgers, A.: "A Novel Forecasting System for Solar Particle Events and Flares (FORSPEF)" 2015, Journal of Physics: Conference Series,632,012075, doi:10.1088/1742-6596/632/1/012075
- Papaioannou A., Sandberg, I., Anastasiadis, A., Georgoulis, M.K., Tsiropoula, G., Tziotziou, K., Jiggens, P., Hilgers, A.: "Solar Flares, Coronal Mass Ejections and Solar Energetic Particle Event Characteristics", Journal of Space Weather and Space Climate, under review 2016
- Reames D.V., "Particle acceleration at the Sun and in the heliosphere", Space Scie. Rev., 90, 413, 1999
- Reames D.V., "The Two Sources of Solar Energetic Particles", American Astronomical Society, AAS Meeting #220, #112.01, 2012
- Sandberg I., Anastasiadis A., Papaioannou A., Georgoulis, M.K., Tsiropoula, G., Tziotziou, K., Jiggens, P., Hilgers, A., "Forecasting and Nowcasting Reductive Statistical Schemes for Solar Energetic Particle Events", 11th European Space Weather Week, 2014
- Webb D.F. and Howard T.A., "Coronal Mass Ejections: Observations", Living Rev. Solar Phys. 9, (2012), 3.